Multiple Choice
Suppose the rate of change of the per capita consumption of cottage cheese in the United States between 1980 and 1999 can be modeled by the function 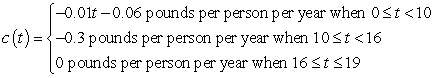 where t is the number of years since 1980. Find the area of the region between the graph and the horizontal axis between
  and
and  . Round your answer to three decimal places.
A) 0.700 pound
B) 2.600 pounds
C) 3.400 pounds
D) 2.900 pounds
E) 9.661 pounds
Correct Answer:

Verified
Correct Answer:
Verified
Q25: Between 1956 and 2000, the rate of
Q26: Suppose the graph shows the energy usage
Q27: Market revenue for Hammer Inc. (in millions
Q28: Suppose the population of a country between
Q29: Suppose the graph shows the energy usage
Q31: Suppose the population of a country between
Q32: Suppose the number of general aviation aircraft
Q33: Evaluate the integral <img src="https://d2lvgg3v3hfg70.cloudfront.net/TB6775/.jpg" alt="Evaluate the
Q34: Find the area of the shaded region.
Q35: Given the graph of f(t) <img src="https://d2lvgg3v3hfg70.cloudfront.net/TB6775/.jpg"