Multiple Choice
Suppose the graph shows the energy usage in megawatts for one day for a large university campus. The daily energy consumption for the campus is measured in megawatt-hours and is found by calculating the area of the region between the graph and the horizontal axis. Estimate, to the nearest 10 megawatt-hours, the daily energy consumption using four left rectangles. 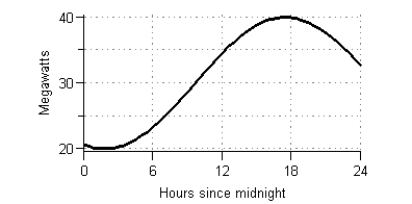
A) 710 megawatt-hours
B) 790 megawatt-hours
C) 910 megawatt-hours
D) 480 megawatt-hours
E) 150 megawatt-hours
Correct Answer:

Verified
Correct Answer:
Verified
Q24: Suppose the rate of change of the
Q25: Between 1956 and 2000, the rate of
Q26: Suppose the graph shows the energy usage
Q27: Market revenue for Hammer Inc. (in millions
Q28: Suppose the population of a country between
Q30: Suppose the rate of change of the
Q31: Suppose the population of a country between
Q32: Suppose the number of general aviation aircraft
Q33: Evaluate the integral <img src="https://d2lvgg3v3hfg70.cloudfront.net/TB6775/.jpg" alt="Evaluate the
Q34: Find the area of the shaded region.