Multiple Choice
Consider the graph of r(t) , the rate of change in the price of a technology stock, during the first 55 days of trading of 2003. Using the information present below, label each region as representing positive or negative change in price. 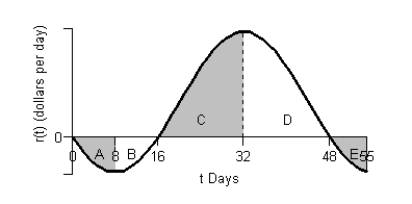

A) 
B) 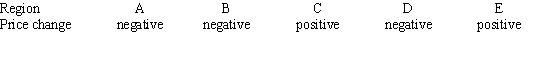
C) 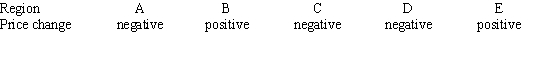
D) 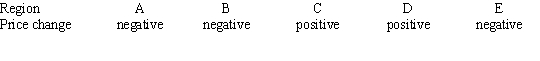
E) 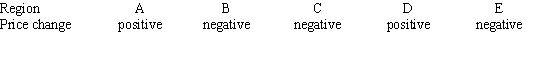
Correct Answer:

Verified
Correct Answer:
Verified
Q40: A table of selected values for a
Q41: Find the indefinite integral. <img src="https://d2lvgg3v3hfg70.cloudfront.net/TB6775/.jpg" alt="Find
Q42: Evaluate the integral <img src="https://d2lvgg3v3hfg70.cloudfront.net/TB6775/.jpg" alt="Evaluate the
Q43: Using data from the U.S. Bureau of
Q44: If possible, find the general antiderivative of
Q45: Find the indefinite integral. <img src="https://d2lvgg3v3hfg70.cloudfront.net/TB6775/.jpg" alt="Find
Q46: The function <img src="https://d2lvgg3v3hfg70.cloudfront.net/TB6775/.jpg" alt="The function
Q47: Blood pressure varies for individuals throughout the
Q48: Consider the graph of the function: <img
Q49: The acceleration of a race car during