Multiple Choice
Consider the graph of f(t) . 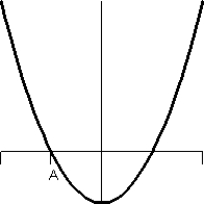 What does the graph of the accumulation function
  look like?
A) 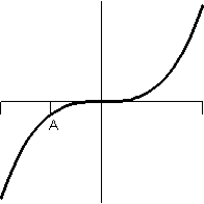
B) 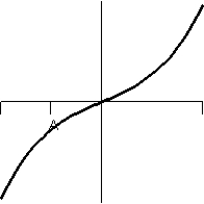
C) 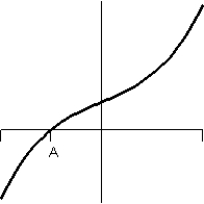
D) 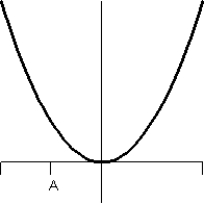
E) 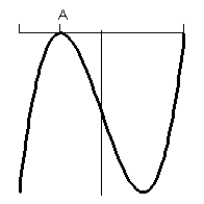
Correct Answer:

Verified
Correct Answer:
Verified
Related Questions
Q17: The cost of producing x units of
Q18: Suppose the population of a country between
Q19: Find the area of the shaded region.
Q20: Consider the graph of f(t). <img src="https://d2lvgg3v3hfg70.cloudfront.net/TB6775/.jpg"
Q21: A table of selected values for a
Q23: Suppose U.S. factory sales of electronic goods
Q24: Suppose the rate of change of the
Q25: Between 1956 and 2000, the rate of
Q26: Suppose the graph shows the energy usage
Q27: Market revenue for Hammer Inc. (in millions