Multiple Choice
A table of selected values for a function is given. Also shown are tables of values for the derivative and the accumulation function with 0 as the starting point. Determine which table contains the values of the derivative,  , and which contains the values of the accumulation function,
  . Justify your choice.
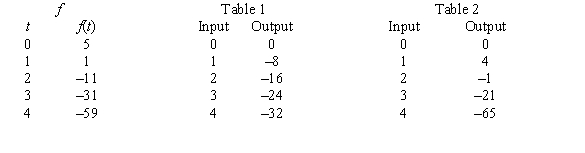
A) Table 1 contains the values of  because f is decreasing and the output values are negative.
Table 2 contains the values of  because its output is close to the cumulative sum of
  .
.
B) Table 1 contains the values of  because f is decreasing and the output values are negative.
Table 2 contains the values of  because
  cannot be negative.
C) Table 1 contains the values of  because its output is close to the cumulative sum of
  .
.
Table 2 contains the values of  because f is decreasing and the output values are negative.
D) Table 1 contains the values of  because the sign of the output does not change.
Table 2 contains the values of  because the output changes sign.
E) Table 1 contains the values of  because the magnitude of the output keeps increasing.
Table 2 contains the values of  because the output changes sign.
Correct Answer:

Verified
Correct Answer:
Verified
Q16: The acceleration of a race car during
Q17: The cost of producing x units of
Q18: Suppose the population of a country between
Q19: Find the area of the shaded region.
Q20: Consider the graph of f(t). <img src="https://d2lvgg3v3hfg70.cloudfront.net/TB6775/.jpg"
Q22: Consider the graph of f(t). <img src="https://d2lvgg3v3hfg70.cloudfront.net/TB6775/.jpg"
Q23: Suppose U.S. factory sales of electronic goods
Q24: Suppose the rate of change of the
Q25: Between 1956 and 2000, the rate of
Q26: Suppose the graph shows the energy usage