Multiple Choice
In the following figure,  gives the population
  of a certain bacteria culture at time t after a portion of bactericide A was introduced into the population at
  . The graph of g gives the population
  of a similar bacteria culture at time t after a portion of bactericide B was introduced into the population at
  .
. 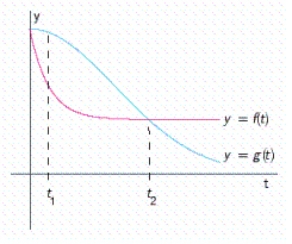 Which population is decreasing faster at
  and at
  ?
?
A) The populations are decreasing at the same rate at  ,
, is decreasing faster at
B)  is decreasing faster at
 ,
, is decreasing faster at
C)  is decreasing faster at
 , the populations are decreasing at the same rate at
D)  is decreasing faster at
 ,
, is decreasing faster at
Correct Answer:

Verified
Correct Answer:
Verified
Q184: The function that gives the cost of
Q185: The circumference of a circle is given
Q186: The graph shows the volume of wood
Q187: Find <img src="https://d2lvgg3v3hfg70.cloudfront.net/TB6026/.jpg" alt="Find given
Q188: By cutting away identical squares from each
Q190: Let <img src="https://d2lvgg3v3hfg70.cloudfront.net/TB6026/.jpg" alt="Let .
Q191: Determine whether the point (- 6, -
Q192: A rectangular box is to have a
Q193: Suppliers of transistor radios will market 10,000
Q194: Find <img src="https://d2lvgg3v3hfg70.cloudfront.net/TB6026/.jpg" alt="Find given