Essay
The graph shows the volume of wood produced in a single-species forest. Here  is measured in cubic meters/hectare and t is measured in years. By computing the slopes of the respective tangent lines, estimate the rate at which the wood grown is changing at the beginning of year 10 and at the beginning of year 40.
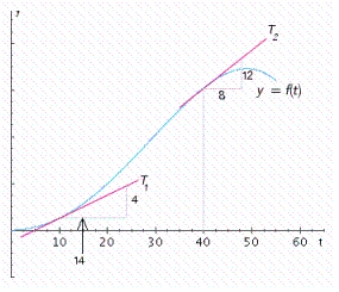
Correct Answer:

Verified
Correct Answer:
Verified
Q181: For the pair of supply and demand
Q182: For the pair of supply and demand
Q183: Find the indicated one-sided limit. <img src="https://d2lvgg3v3hfg70.cloudfront.net/TB6026/.jpg"
Q184: The function that gives the cost of
Q185: The circumference of a circle is given
Q187: Find <img src="https://d2lvgg3v3hfg70.cloudfront.net/TB6026/.jpg" alt="Find given
Q188: By cutting away identical squares from each
Q189: In the following figure, <img src="https://d2lvgg3v3hfg70.cloudfront.net/TB6026/.jpg" alt="In
Q190: Let <img src="https://d2lvgg3v3hfg70.cloudfront.net/TB6026/.jpg" alt="Let .
Q191: Determine whether the point (- 6, -