True/False
The scatter diagram below depicts data with a negative linear relationship. 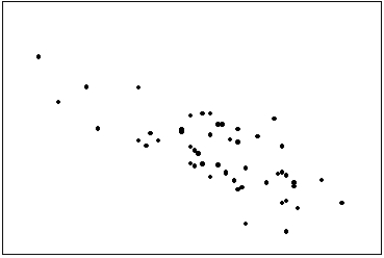
Correct Answer:

Verified
Correct Answer:
Verified
Related Questions
Q25: Bar and pie charts are graphical techniques
Q35: Internet Classes<br>A survey of 25 students
Q63: Which of the following statements about shapes
Q68: Which of the following statements is false?<br>A)You
Q84: How do you determine whether two interval
Q90: A bar chart is used to represent
Q93: All calculations are permitted on interval data.
Q118: Suppose you measure the number of minutes
Q124: The first scatter diagram below shows a
Q136: A line chart is created by plotting