True/False
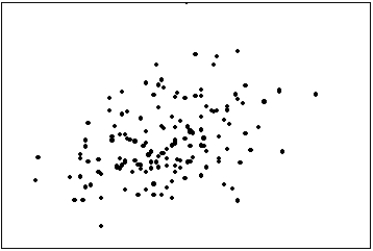
The first scatter diagram below shows a stronger linear relationship than the second scatter diagram. (Assume the scales on both scatter diagrams are the same.) 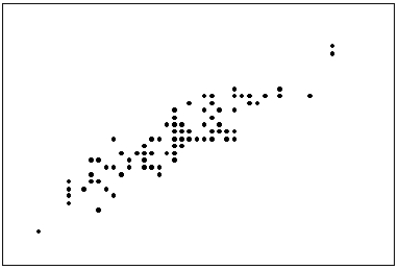
Correct Answer:

Verified
Correct Answer:
Verified
Related Questions
Q35: Internet Classes<br>A survey of 25 students
Q68: Which of the following statements is false?<br>A)You
Q84: How do you determine whether two interval
Q90: A bar chart is used to represent
Q92: Values must represent ordered rankings for what
Q93: All calculations are permitted on interval data.
Q102: If the data in a scatter diagram
Q121: The scatter diagram below depicts data with
Q136: A line chart is created by plotting
Q157: What values are displayed on a cumulative