Essay
Given the graph below, use 5 rectangles to estimate the area under the graph from x = 0 to x = 5. Compute L5 (sample points are left endpoints), R5 (sample points are right endpoints) and M5 (sample points are midpoints). Which of the estimates appears to give the best estimate? Justify your answer. 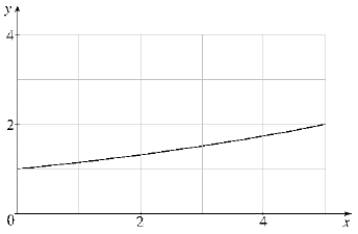
Correct Answer:

Verified
L5  6.6; R5 7.6; M5 7...
View Answer
Unlock this answer now
Get Access to more Verified Answers free of charge
Correct Answer:
Verified
View Answer
Unlock this answer now
Get Access to more Verified Answers free of charge
Q16: Given functions of <span class="ql-formula"
Q17: Let <span class="ql-formula" data-value="f (
Q18: What is the largest value of
Q19: Sketch a plane region whose area
Q20: Evaluate <span class="ql-formula" data-value="\int \frac
Q22: Use Definition 2 to show that
Q23: Evaluate the following integrals:<br>(a) <span
Q24: Evaluate the following integrals:<br>(a) <span
Q25: Two students use Simpson's Rule to
Q26: Let <span class="ql-formula" data-value="f (