Multiple Choice
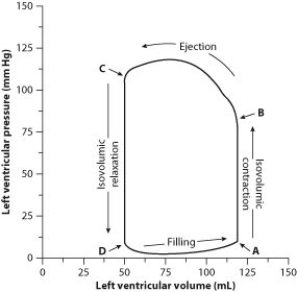
To evaluate cardiac function, scientists and physicians measure both the pressure and the volume inside the heart. When both pressure and volume data are plotted on the same graph, the resulting graph is called a pressure-volume loop. To create a pressure-volume loop, a catheter (a thin tube) is inserted into the vessels of the heart, and measurements of both left ventricular pressure and left ventricular volume are taken. The data are plotted on a graph, and cardiac function can then be evaluated from the distribution of the data and the shape of the loop.
The following figure shows a typical left ventricle pressure-volume loop for a healthy young adult. The cardiac cycle proceeds counterclockwise. Each complete turn around the loop (for example, starting at point A and ending back at point A) represents one complete cardiac cycle.
-What part of the diagram represents ventricular diastole?
A) point B
B) point C
C) the line between points A and B
D) the line between points C and D
Correct Answer:

Verified
Correct Answer:
Verified
Q71: To evaluate cardiac function, scientists and physicians
Q72: Which of the following is the cause
Q73: During exercise, your cardiac output can increase
Q74: Hematocrit is the percentage of red blood
Q75: From the left ventricle, oxygen-rich blood flows
Q76: You conduct a study with mice to
Q77: In which part of this figure would
Q78: Which part of this figure depicts an
Q79: Blood clots are formed by platelets and
Q80: The location of the heart's pacemaker is