Multiple Choice
Electrocardiographs (ECGs or EKGs) provide data about the electrical activity of the heart. By placing a series of "leads" on a person's chest, the electrical activity of the heart can be recorded and analyzed in order to detect irregular heartbeats (arrhythmias) and other conditions. The figure below shows a normal EKG tracing for one cardiac cycle.
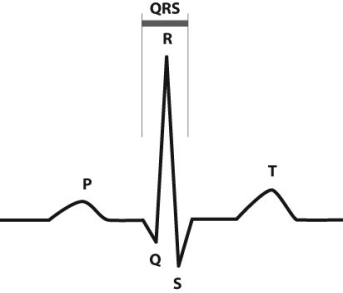 The P region represents electrical activity spreading through the atria. The QRS region represents electrical activity spreading through the ventricles. The T region represents electrical activity in the ventricles returning to rest.
-Suppose a person has a heart rate of 60 beats/min and that the start of the P region until the end of the T region represents one cardiac cycle. If the x axis in the EKG is time, approximately how much time passes between the start of the P region and the end of the T region?
A) 0.1 second
B) 1 second
C) 10 seconds
D) 60 seconds
Correct Answer:

Verified
Correct Answer:
Verified
Q40: How long do human red blood cells
Q41: Arteries are distinguished from veins based on
Q42: In which of the following human blood
Q43: Myocardial infarction, also called a heart attack,<br>A)
Q44: Electrocardiographs (ECGs or EKGs) provide data about
Q46: Using a stethoscope, you listen to a
Q47: Which of the following animals has a
Q48: One way that substances move between blood
Q49: In mammals, blood returning from the head
Q50: During exercise, your heart rate can increase