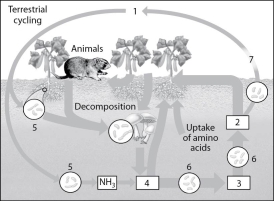
menu-iconExamlexExamLexServices

Discover

Ask a Question
  1. All Topics
  2. Topic
    Biology
  3. Study Set
    Campbell Biology in Focus
  4. Exam
    Exam 42: Ecosystems and Energy
  5. Question
    Figure 42.3 -In the Diagram of the Nitrogen Cycle in Figure 42.3
Solved

Figure 42.3 -In the Diagram of the Nitrogen Cycle in Figure 42.3

Question 69

Question 69

Multiple Choice

  Figure 42.3 -In the diagram of the nitrogen cycle in Figure 42.3, which number represents nitrifying bacteria? A)  5 B)  6 C)  7 Figure 42.3
-In the diagram of the nitrogen cycle in Figure 42.3, which number represents nitrifying bacteria?


A) 5
B) 6
C) 7

Correct Answer:

verifed

Verified

Unlock this answer now
Get Access to more Verified Answers free of charge

Related Questions

Q7: Approximately how many kg of carnivore biomass

Q18: Which of the following organisms is incorrectly

Q30: Nitrifying bacteria participate in the nitrogen cycle

Q55: Approximately 1% of the solar radiation that

Q64: <img src="https://d2lvgg3v3hfg70.cloudfront.net/TB6147/.jpg" alt=" Figure 42.1 Food

Q65: <img src="https://d2lvgg3v3hfg70.cloudfront.net/TB6147/.jpg" alt=" Figure 42.1 Food

Q66: Which of the following locations is the

Q68: A porcupine eats 3,000 J of plant

Q73: How do the Taylor Glacier bacteria produce

Q76: How is it that satellites can detect

Examlex

ExamLex

About UsContact UsPerks CenterHomeschoolingTest Prep

Work With Us

Campus RepresentativeInfluencers

Links

FaqPricingChrome Extension

Download The App

Get App StoreGet Google Play

Policies

Privacy PolicyTerms of ServiceHonor CodeCommunity Guidelines

Scan To Download

qr-code

Copyright © (2025) ExamLex LLC.

Privacy PolicyTerms Of ServiceHonor CodeCommunity Guidelines