Multiple Choice
The next questions refer to Table 20.1, which compares the % sequence homology of four different parts (two introns and two exons) of a gene that is found in five different eukaryotic species. Each part is numbered to indicate its distance from the promoter (e.g., Intron I is the one closest to the promoter) . The data reported for species A were obtained by comparing DNA from one member of species A to the DNA of another member of species A.
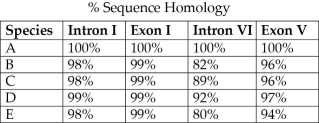 Table 20.1
-Based on the tabular data, and assuming that time advances vertically, which cladogram (a type of phylogenetic tree) is the most likely depiction of the evolutionary relationships among these five species?
A) 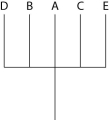
B) 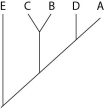
C) 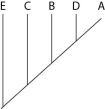
D) 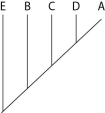
Correct Answer:

Verified
Correct Answer:
Verified
Q1: Cladograms (a type of phylogenetic tree)constructed from
Q5: Three living species X, Y, and Z
Q6: <img src="https://d2lvgg3v3hfg70.cloudfront.net/TB6147/.jpg" alt=" Figure 20.4 Humans,
Q10: The following questions refer to the phylogenetic
Q16: When using a cladistic approach to systematics,
Q17: There is some evidence that reptiles called
Q22: Linnaeus was a "fixist" who believed that
Q59: When it acts upon a gene, which
Q63: Which eukaryotic kingdom is polyphyletic, and therefore
Q67: If you were using cladistics to build