Multiple Choice
Which graph best describes how the vapor pressure of a substance varies with temperature according to the Clausius-Clapeyron equation? ln(P) is plotted on the y-axis, and 1/T is plotted on the x-axis. The origin (0, 0) is not necessarily located where the axes cross. 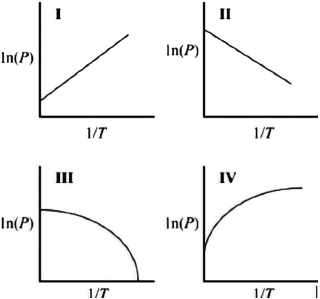
A) I
B) II
C) III
D) IV
Correct Answer:

Verified
Correct Answer:
Verified
Q119: Which of the following is needed to
Q120: Calculate the minimum pressure that must be
Q121: Coulomb's law states that the interaction energy
Q122: Rank the following ionic compounds based on
Q123: A solution is prepared by adding 0.250
Q125: What is the molarity of a 0.923
Q126: In the following Born-Haber cycle for the
Q127: A newspaper article suggested using a fertilizer
Q128: In the following Born-Haber cycle for the
Q129: A solution is prepared by adding 1.50