Multiple Choice
The heating curve for a substance is shown below. The substance initially is a solid. It then becomes a liquid and a gas. Which of the line segments (I-V) represents the solid-to-liquid phase transition? 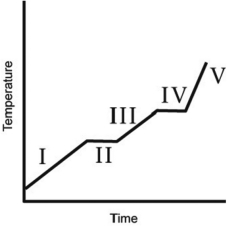
A) I
B) II
C) III
D) IV
E) V
Correct Answer:

Verified
Correct Answer:
Verified
Related Questions
Q10: Which of the changes A-D will always
Q11: If a chemical reaction causes the temperature
Q12: An expanding gas does 175 kJ of
Q13: When solid sodium hydroxide (NaOH) pellets are
Q14: The complete combustion of 2.500 g of
Q16: A food sample was burned in a
Q17: Work requires _<br>A)a use of potential energy.<br>B)a
Q18: What is the change in internal energy
Q19: Determine the enthalpy for the following reaction,
Q20: State Hess's law as it applies to