Multiple Choice
This graph shows the feasible region (defined by points ACDEF) and objective function level curve (BG) for a maximization problem. Which point corresponds to the optimal solution to the problem? 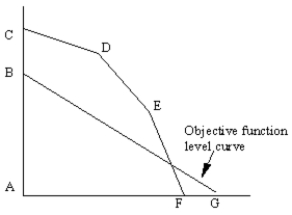
A) A
B) B
C) C
D) D
E) E
Correct Answer:

Verified
Correct Answer:
Verified
Related Questions
Q2: Solve the following LP problem graphically by
Q3: The number of units to ship from
Q4: A company makes two products, X<sub>1</sub> and
Q5: Which of the following special conditions in
Q6: A set of values for the decision
Q7: Solve the following LP problem graphically using
Q8: The desire to maximize profits is an
Q9: If constraints are added to an LP
Q10: The objective function for a LP model
Q11: A facility produces two products. The labor