Essay
Exhibit 10.6
The information below is used for the following questions.
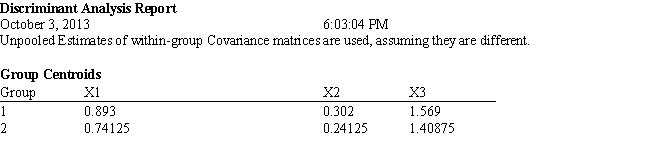
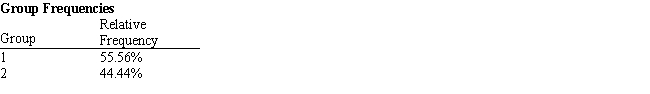
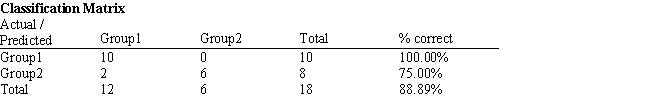
An investor wants to classify companies as being either a good investment, Group 1, or a poor investment, Group 2. He has gathered Liquidity, Profitability and Activity data on 18 companies he has invested in and run a regression analysis. Discriminant Analysis output has also been generated. The data for the problem and the relevant output are shown below. 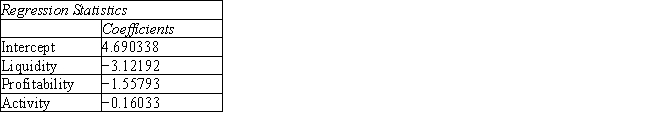
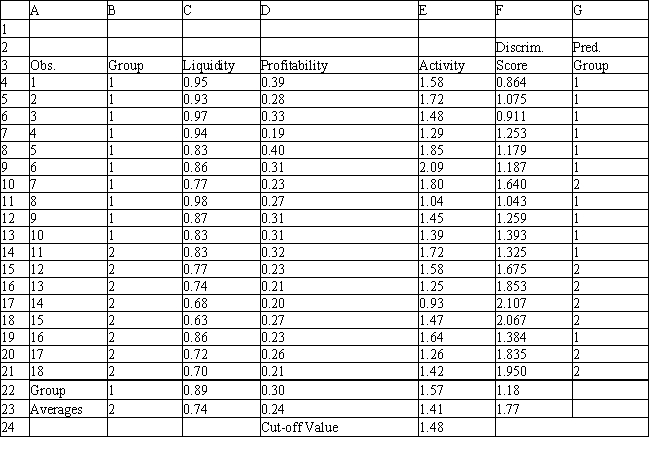
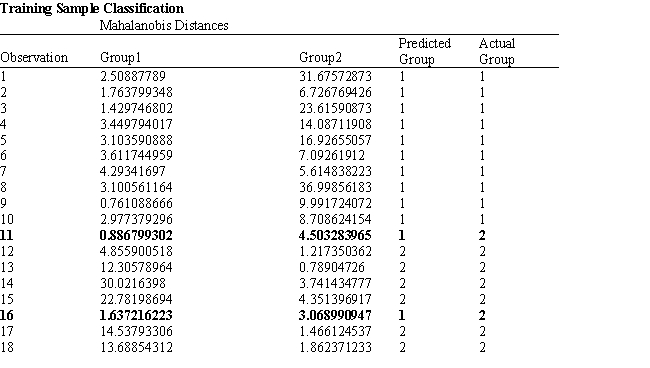
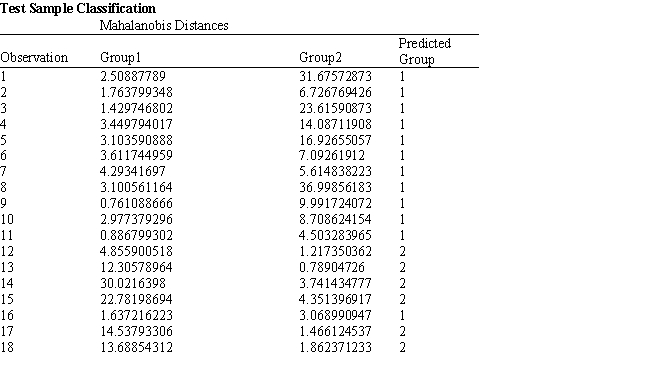
-Refer to Exhibit 10.6. Compute the discriminant score and predicted group for a company with Liquidity = 0.80, Profitability = 0.27 and Activity = 1.55.
Correct Answer:

Verified
DISCRIMINA...View Answer
Unlock this answer now
Get Access to more Verified Answers free of charge
Correct Answer:
Verified
View Answer
Unlock this answer now
Get Access to more Verified Answers free of charge
Q32: Normalization of data involves<br>A) expressing each variable
Q33: Neural networks classification methodology<br>A) is one of
Q34: Data mining is the process of finding
Q35: Exhibit 10.7<br>The information below is used for
Q36: Exhibit 10.1<br>The following questions are based on
Q38: In using neural networks, an analyst must
Q39: Exhibit 10.1<br>The following questions are based on
Q40: Suppose that the observations are partitioned into
Q41: A _ provides a visual summary of
Q42: Exhibit 10.3<br>The information below is used for