Essay
Exhibit 10.7
The information below is used for the following questions.
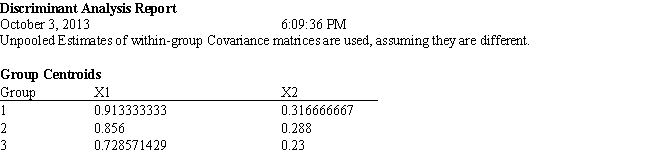
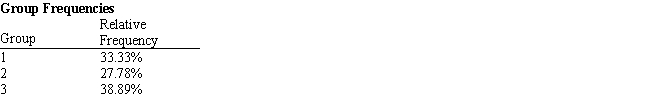
An investor wants to classify companies as being a High Risk Investment, Group 1, a Medium Risk Investment, Group 2, or a Low Risk Investment, Group 3. He has gathered Liquidity, Profitability data on 18 companies he has invested in and produced the following spreadsheet. The following Discriminant Analysis output using Analytic Solver Platform has also been generated. 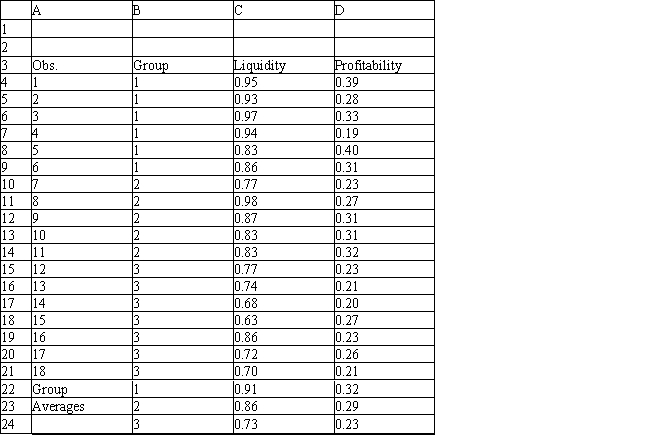
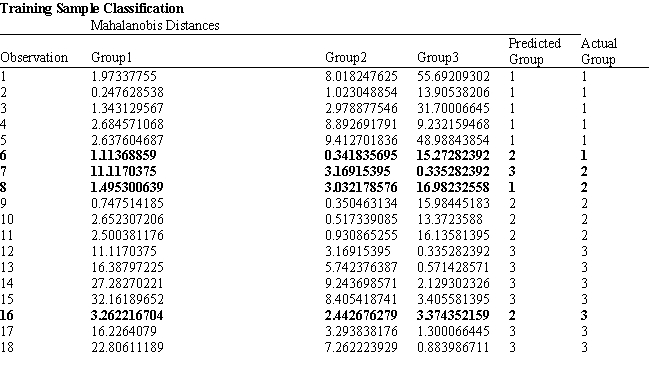
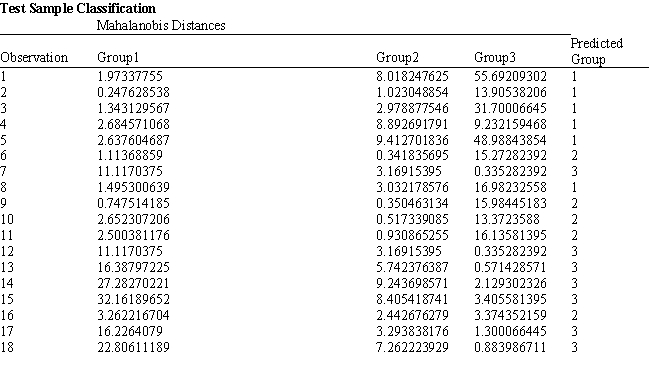
-Refer to Exhibit 10.7. Based on the 18 observations in the model complete the following confusion/classification matrix. 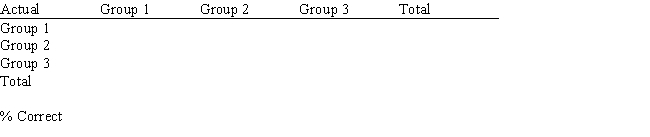
Correct Answer:

Verified
Correct Answer:
Verified
Q30: The k-nearest neighbor classification technique<br>A) identifies the
Q31: In a two-group discriminant analysis problem using
Q32: Normalization of data involves<br>A) expressing each variable
Q33: Neural networks classification methodology<br>A) is one of
Q34: Data mining is the process of finding
Q36: Exhibit 10.1<br>The following questions are based on
Q37: Exhibit 10.6<br>The information below is used for
Q38: In using neural networks, an analyst must
Q39: Exhibit 10.1<br>The following questions are based on
Q40: Suppose that the observations are partitioned into