Short Answer
Exhibit 13.7
The following questions refer to the information and output below.
A tax accountant has found that the time to serve a customer has a mean of 30 minutes (or 0.5 hours) and a standard deviation of 6 minutes (or 0.1 hours). Customer arrivals follow a Poisson distribution with an average of 60 minutes between arrivals. The following queuing analysis spreadsheet was developed from this information. 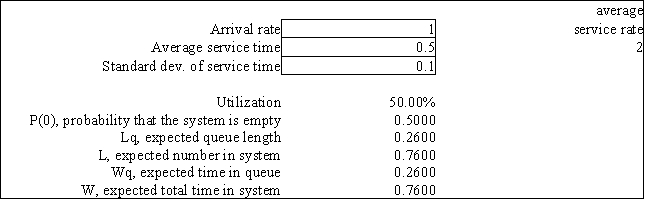
-Refer to Exhibit 13.7. What is the Kendall notation for this system?
Correct Answer:

Verified
Correct Answer:
Verified
Q34: A company has recorded the following list
Q35: Exhibit 13.5<br>The following questions refer to the
Q36: Exhibit 13.7<br>The following questions refer to the
Q37: Exhibit 13.1<br>The following questions are based on
Q38: Exhibit 13.1<br>The following questions are based on
Q40: Exhibit 12.5<br>The following questions use the information
Q41: Customers arrive at a store randomly, following
Q42: Exhibit 13.4<br>The following questions refer to the
Q43: Exhibit 13.2<br>The following questions refer to the
Q44: Exhibit 13.1<br>The following questions are based on