Short Answer
Exhibit 13.4
The following questions refer to the information and output below.
A grocery store can serve an average of 360 customers per hour. The service times are exponentially distributed. The store has 4 checkout lines each of which serves 90 customers per hour. Customers arrive at the store at a Poisson rate of 240 customers per hour. The following queuing analysis spreadsheet was developed from this information. 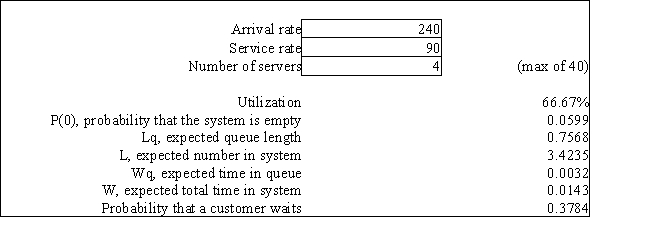
-Refer to Exhibit 13.4. Based on this report what is the average number of customers waiting for a checker?
Correct Answer:

Verified
Correct Answer:
Verified
Q37: Exhibit 13.1<br>The following questions are based on
Q38: Exhibit 13.1<br>The following questions are based on
Q39: Exhibit 13.7<br>The following questions refer to the
Q40: Exhibit 12.5<br>The following questions use the information
Q41: Customers arrive at a store randomly, following
Q43: Exhibit 13.2<br>The following questions refer to the
Q44: Exhibit 13.1<br>The following questions are based on
Q45: Exhibit 13.3<br>The following questions refer to the
Q46: Exhibit 12.5<br>The following questions use the information
Q47: Exhibit 12.5<br>The following questions use the information