Multiple Choice
The following graph is a 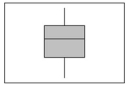
A) Dot plot
B) Stem-and-leaf display
C) Box plot
D) Contingency table
Correct Answer:

Verified
Correct Answer:
Verified
Related Questions
Q7: A dot plot is best applied for
Q22: If a distribution is negatively skewed,the distribution
Q27: Given the sample information in the following
Q29: A telemarketing firm is monitoring the performance
Q32: For the following data, what is the
Q34: For the following data, are any of
Q51: A dot plot shows the symmetry of
Q62: The coefficient of skewness is the standard
Q70: A box plot shows _.<br>A) The mean
Q91: In a distribution, the second quartile corresponds