Short Answer
A telemarketing firm is monitoring the performance of its employees based on the number of sales per hour. One employee had the following sales for the last 19 hours. 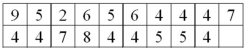 What is the first quartile for the distribution of number of sales per hour?
Correct Answer:

Verified
Q1 = 4 sal...View Answer
Unlock this answer now
Get Access to more Verified Answers free of charge
Correct Answer:
Verified
View Answer
Unlock this answer now
Get Access to more Verified Answers free of charge
Q7: A dot plot is best applied for
Q20: A relationship between two nominal variables is
Q27: Given the sample information in the following
Q30: The following graph is a <img src="https://d2lvgg3v3hfg70.cloudfront.net/TB4677/.jpg"
Q32: For the following data, what is the
Q34: For the following data, are any of
Q51: A dot plot shows the symmetry of
Q62: The coefficient of skewness is the standard
Q70: A box plot shows _.<br>A) The mean
Q91: In a distribution, the second quartile corresponds