Multiple Choice
The following graph illustrates _______________. 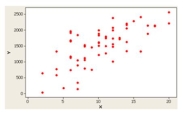
A) A positive or direct relationship
B) A negative or inverse relationship
C) No relationship
D) A distribution for a single variable
Correct Answer:

Verified
Correct Answer:
Verified
Related Questions
Q21: What is the value of the Pearson
Q25: What is the common purpose of a
Q28: In a negatively skewed distribution, the coefficient
Q33: In a contingency table, we describe the
Q34: A box plot graphically shows the 10<sup>th</sup>
Q46: Quartiles divide a distribution into 10 equal
Q75: A sample of the homes currently offered
Q77: For the following data, are any of
Q79: Given the sample information in the following
Q81: For the following data, what relationship is