Essay
For the following data, what relationship is shown in the graph? 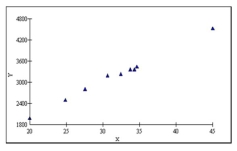
Correct Answer:

Verified
A positive...View Answer
Unlock this answer now
Get Access to more Verified Answers free of charge
Correct Answer:
Verified
A positive...
View Answer
Unlock this answer now
Get Access to more Verified Answers free of charge
Related Questions
Q21: What is the value of the Pearson
Q25: What is the common purpose of a
Q28: In a negatively skewed distribution, the coefficient
Q33: In a contingency table, we describe the
Q34: A box plot graphically shows the 10<sup>th</sup>
Q46: Quartiles divide a distribution into 10 equal
Q51: If a student places in the 99<sup>th</sup>
Q77: For the following data, are any of
Q79: Given the sample information in the following
Q80: The following graph illustrates _. <img src="https://d2lvgg3v3hfg70.cloudfront.net/TB4677/.jpg"