Short Answer
A telemarketing firm is monitoring the performance of its employees based on the number of sales per hour. One employee had the following sales for the last 19 hours. 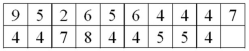 What is the third quartile for the distribution of number of sales per hour?
Correct Answer:

Verified
Q3 = 7 sal...View Answer
Unlock this answer now
Get Access to more Verified Answers free of charge
Correct Answer:
Verified
View Answer
Unlock this answer now
Get Access to more Verified Answers free of charge
Q1: If the mean of a distribution is
Q2: A dot plot is useful for showing
Q4: A scatter diagram of sales versus production
Q5: A scatter diagram is used to illustrate
Q24: In a scatter diagram, we describe the
Q27: What is the possible range of values
Q60: What is the difference between a scatter
Q63: The test scores for a class of
Q63: For the following data, what is the
Q97: Outliers are clearly presented in a _.<br>A)