Short Answer
For the following data, what is the interquartile range? 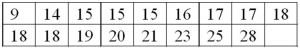
Correct Answer:

Verified
Correct Answer:
Verified
Related Questions
Q2: A dot plot is useful for showing
Q4: A scatter diagram of sales versus production
Q9: A _ is the best way to
Q16: If the coefficient of skewness is equal
Q36: A scatter diagram of sales versus production
Q62: For the following data, find the information
Q63: The test scores for a class of
Q68: A telemarketing firm is monitoring the performance
Q81: A dot plot can be used to
Q97: Outliers are clearly presented in a _.<br>A)