Multiple Choice
A student was interested in the cigarette smoking habits of college students and collected data from an unbiased random sample of students. The data is summarized in the following table: 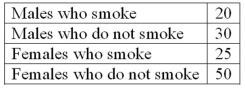 What type of chart best represents relative class frequencies?
A) Box plot
B) Pie chart
C) Scatter plot
D) Frequency polygon
Correct Answer:

Verified
Correct Answer:
Verified
Q43: A student was studying the political party
Q53: In a deck of cards, a class
Q85: A _ chart is useful for displaying
Q119: Refer to the following distribution of commissions:
Q120: Refer to the following frequency distribution on
Q121: Refer to the following frequency distribution on
Q122: The following frequency distribution shows the distribution
Q123: Refer to the following breakdown of responses
Q124: Refer to the following distribution: <img src="https://d2lvgg3v3hfg70.cloudfront.net/TB4677/.jpg"
Q127: The following frequency distribution shows the distribution