Multiple Choice
Refer to the following distribution of commissions: 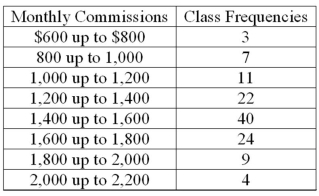 To plot a cumulative frequency distribution, the first coordinate would be _________.
A) X = 0, Y = 600
B) X = 500, Y = 3
C) X = 3, Y = 600
D) X = 600, Y = 0
Correct Answer:

Verified
Correct Answer:
Verified
Related Questions
Q7: In frequency distributions,classes are mutually exclusive if
Q11: A pie chart shows the _.<br>A) Relative
Q25: To calculate a relative frequency, a class
Q46: The first three class marks for a
Q63: A data set consists of 40 observations.
Q74: For a relative frequency distribution, relative frequency
Q75: Refer to the following breakdown of responses
Q77: For the following distribution of heights, what
Q79: Refer to the following breakdown of responses
Q82: Refer to the following breakdown of responses