Multiple Choice
Refer to the following breakdown of responses to a survey of room service in a hotel. 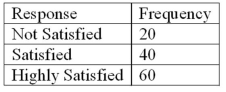 What type of chart should be used to show relative class frequencies?
A) A pie chart
B) A bar chart
C) A histogram
D) A frequency polygon
Correct Answer:

Verified
Correct Answer:
Verified
Q7: In frequency distributions,classes are mutually exclusive if
Q11: A pie chart shows the _.<br>A) Relative
Q46: The first three class marks for a
Q63: A data set consists of 40 observations.
Q74: For a relative frequency distribution, relative frequency
Q75: Refer to the following breakdown of responses
Q77: For the following distribution of heights, what
Q78: Refer to the following distribution of commissions:
Q82: Refer to the following breakdown of responses
Q84: Refer to the following distribution of ages: