Multiple Choice
Refer to the following distribution of ages: 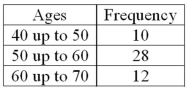 What is the class interval?
A) 9
B) 10
C) 10.5
D) 11
Correct Answer:

Verified
Correct Answer:
Verified
Related Questions
Q13: A _ chart is useful for displaying
Q31: Unorganized data is referred to as _
Q38: In a bar chart,the heights of the
Q46: A group of 100 students were surveyed
Q68: A pie chart shows the relative frequency
Q76: The number of observations in each class
Q78: A data set has 200 observations. In
Q94: Refer to the following breakdown of responses
Q95: Refer to the following breakdown of responses
Q96: The following frequency distribution shows the distribution