Essay
Refer to the following breakdown of responses to a survey of room cleanliness in a hotel. 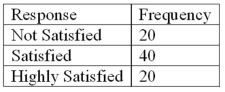 Draw a bar graph that illustrates the relative frequencies.
Correct Answer:

Verified
Correct Answer:
Verified
Related Questions
Q13: A _ chart is useful for displaying
Q31: Unorganized data is referred to as _
Q38: In a bar chart,the heights of the
Q61: To summarize the gender of students attending
Q68: A pie chart shows the relative frequency
Q76: The number of observations in each class
Q93: Refer to the following distribution of ages:
Q94: Refer to the following breakdown of responses
Q96: The following frequency distribution shows the distribution
Q99: When data is collected using a quantitative,