Multiple Choice
Refer to the following breakdown of responses to a survey of "Are you concerned about being tracked while connected to the Internet?" 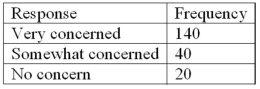 What type of chart should be used to describe the frequency table?
A) A pie chart
B) A bar chart
C) A histogram
D) A frequency polygon
Correct Answer:

Verified
Correct Answer:
Verified
Q14: To convert a frequency distribution to a
Q19: A cumulative frequency distribution is used when
Q23: Refer to the following information from a
Q34: The following frequency distribution shows the distribution
Q37: A frequency distribution groups data into classes
Q40: Refer to the following breakdown of responses
Q43: Refer to the following distribution: <img src="https://d2lvgg3v3hfg70.cloudfront.net/TB4677/.jpg"
Q75: In a frequency distribution, a class defined
Q104: To construct a bar chart, the class
Q116: In a relative frequency distribution, the sum