Short Answer
The following frequency distribution shows the distribution of delivery times (in days) for swimstuff.com customer orders during the last month. 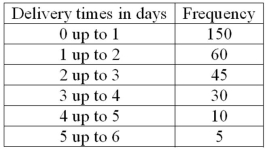 How many orders were delivered in less than one day?
Correct Answer:

Verified
Correct Answer:
Verified
Q13: A pie chart is similar to a
Q19: A cumulative frequency distribution is used when
Q29: The following frequency distribution shows the distribution
Q30: Refer to the following distribution: <img src="https://d2lvgg3v3hfg70.cloudfront.net/TB4677/.jpg"
Q37: A frequency distribution groups data into classes
Q39: Refer to the following breakdown of responses
Q75: In a frequency distribution, a class defined
Q104: To construct a bar chart, the class
Q109: A table showing the number of observations
Q130: A _ is useful for displaying the