Short Answer
The following frequency distribution shows the distribution of delivery times (in days) for swimstuff.com customer orders during the last month. 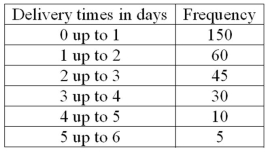 What is the relative frequency for orders delivered in three days or more?
Correct Answer:

Verified
Correct Answer:
Verified
Q13: A pie chart is similar to a
Q24: Refer to the following distribution of ages:
Q25: Refer to the following breakdown of responses
Q28: Refer to the following breakdown of responses
Q30: Refer to the following distribution: <img src="https://d2lvgg3v3hfg70.cloudfront.net/TB4677/.jpg"
Q34: The following frequency distribution shows the distribution
Q87: When a class interval is expressed as
Q109: A table showing the number of observations
Q114: The midpoint of a class interval is
Q130: A _ is useful for displaying the