Multiple Choice
The figure given below depicts the long run equilibrium in an economy. Figure 14.1 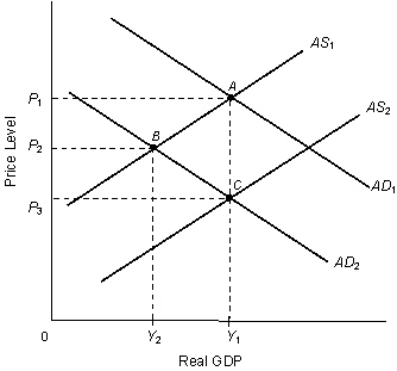 In the figure:
AD1 and AD2: Aggregate demand curves
AS1 and AS2: Aggregate supply curves
Refer to Figure 14.1.When the economy moves from point B to point C:
A) both the unemployment rate and the rate of inflation increases.
B) both the unemployment rate and the rate of inflation declines.
C) the unemployment rate declines at the cost of higher inflation.
D) the rate of inflation declines at the cost of a higher unemployment rate.
E) the rate of inflation declines with no change in the unemployment rate.
Correct Answer:

Verified
Correct Answer:
Verified
Q63: One factor that explains the short-run tradeoff
Q64: Which of the following was sanctioned by
Q65: Which of the following gives the Fed
Q66: Which of the following factors have not
Q67: The figure given below shows the Phillips
Q69: The pursuit of low unemployment rates must
Q70: Critics of the Federal Reserve maintain that,
Q71: The money supply increases when, other things
Q72: One of the most important factors in
Q73: According to the regulation Q, the maximum