Multiple Choice
The figure given below shows the Phillips curves of the U.S.economy during early 1960s to late 1970s. Figure 14.2 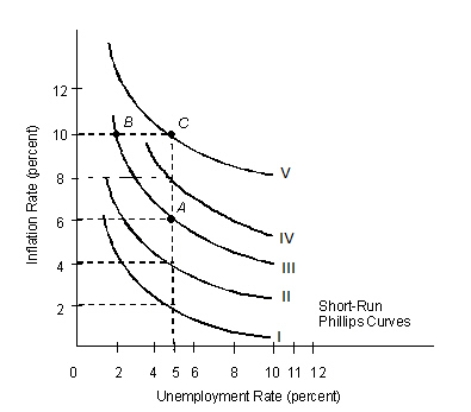 Refer to Figure 14.2.Following the movement from point A to point B on Phillips curve III, what would cause the Phillips curve to shift up so that 5 percent unemployment is associated with 10 percent inflation?
A) A movement up the aggregate supply curve
B) A movement down the aggregate supply curve
C) A movement down the aggregate demand curve
D) An outward shift of the aggregate supply curve
E) An inward shift of the aggregate supply curve
Correct Answer:

Verified
Correct Answer:
Verified
Q62: According to the theory of rational expectations,
Q63: One factor that explains the short-run tradeoff
Q64: Which of the following was sanctioned by
Q65: Which of the following gives the Fed
Q66: Which of the following factors have not
Q68: The figure given below depicts the long
Q69: The pursuit of low unemployment rates must
Q70: Critics of the Federal Reserve maintain that,
Q71: The money supply increases when, other things
Q72: One of the most important factors in