Multiple Choice
The figure given below depicts the equilibrium in the foreign exchange market. Figure 13.1 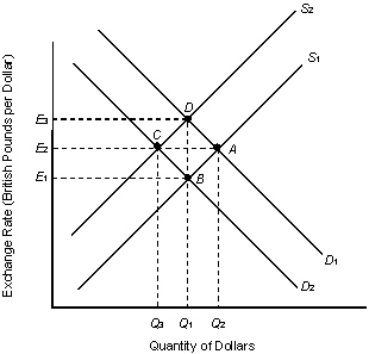 Refer to Figure 13.1.Which of the following is most likely to cause equilibrium to change from point A to point D?
A) A decrease in U.S.demand for British goods and services
B) An increase in U.S.demand for British goods and services
C) An increase in the supply of dollars on the foreign exchange market
D) A decrease in the supply of British pounds on the foreign exchange market
E) An increase in British demand for U.S.exports
Correct Answer:

Verified
Correct Answer:
Verified
Q64: Which of the following is true of
Q65: All members of the Federal Board of
Q66: The interest rate that banks pay for
Q67: Scenario 13.2 Assume the following conditions hold.<br><img
Q68: Table 13.1 <img src="https://d2lvgg3v3hfg70.cloudfront.net/TB2060/.jpg" alt="Table 13.1
Q70: The Fed can enhance liquidity in the
Q71: If the money supply is $80 billion,
Q72: When the government raises spending to promote
Q73: During the Christmas holiday season, the Fed
Q74: The table given below shows the assets