Multiple Choice
The figure below shows revenue and cost curves of a natural monopoly firm. Figure 12.1 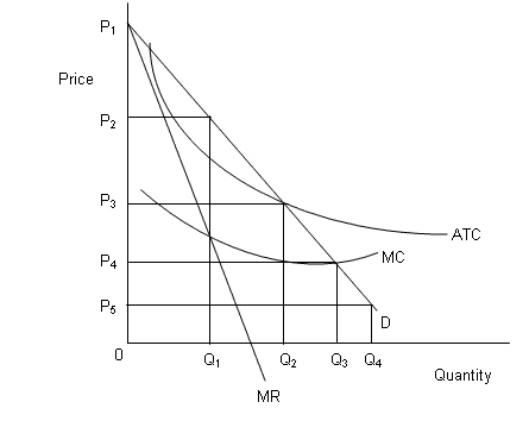 In the figure,
D: Demand curve
MR: Marginal revenue curve
MC: Marginal cost curve
ATC: Average total cost curve
According to Figure 12.1, the price under perfect competition will be:
A) P1.
B) P3.
C) P5.
D) P4.
E) P2.
Correct Answer:

Verified
Correct Answer:
Verified
Q2: Which of the following factors helps to
Q10: Which of the following are the three
Q12: If a market becomes deregulated and is
Q34: The recession beginning in 2007 led many
Q50: The figure below shows revenue and cost
Q67: In the following figure, the first panel
Q73: The three phases of antitrust policy in
Q76: The figure below shows revenue and cost
Q87: The first phase of antitrust policy in
Q96: Cities and local governments in the United