Multiple Choice
The figure below shows revenue and cost curves of a natural monopoly firm. Figure 12.1 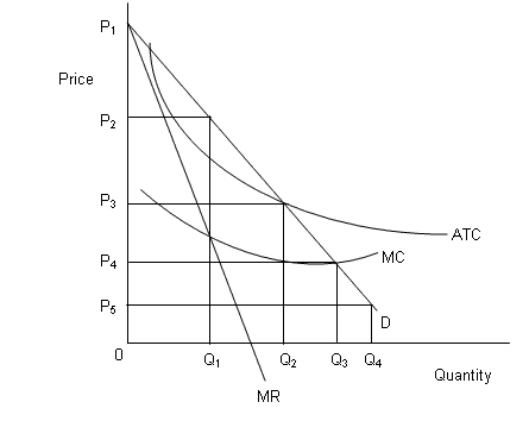 In the figure,
D: Demand curve
MR: Marginal revenue curve
MC: Marginal cost curve
ATC: Average total cost curve
According to Figure 12.1, to attain allocative efficiency the regulatory body must attempt to set the price equal to:
A) P2.
B) P3.
C) P1.
D) P4.
E) P5.
Correct Answer:

Verified
Correct Answer:
Verified
Q10: Which of the following are the three
Q11: In the following figure, the first panel
Q12: If a market becomes deregulated and is
Q34: The recession beginning in 2007 led many
Q52: The figure below shows revenue and cost
Q67: In the following figure, the first panel
Q73: The three phases of antitrust policy in
Q76: The figure below shows revenue and cost
Q77: Graphically,consumer surplus is the area:<br>A)above the demand
Q96: Cities and local governments in the United