Multiple Choice
The figure below shows revenue and cost curves of a natural monopoly firm. Figure 12.1 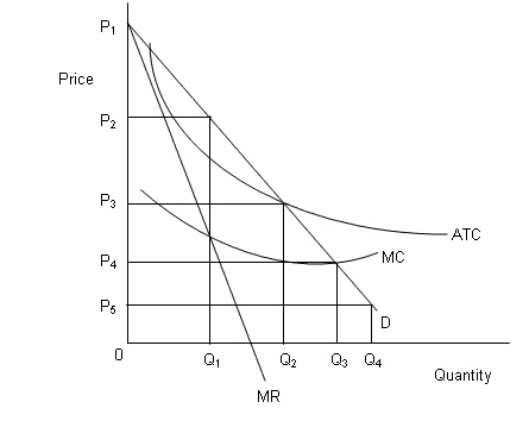 In the figure,
D: Demand curve
MR: Marginal revenue curve
MC: Marginal cost curve
ATC: Average total cost curve
Refer to Figure 12.1.If the regulatory agency sets the fair-rate-of-return price, the monopolist will:
A) suspend production.
B) just break even.
C) earn super normal profits.
D) incur losses.
E) be able to cover only the variable costs.
Correct Answer:

Verified
Correct Answer:
Verified
Q1: Why do the regulated companies oppose deregulation?<br>A)They
Q12: In the following figure, the first panel
Q13: In the following figure, the first panel
Q13: If social regulation increases a firm's fixed
Q24: In the following figure, the first panel
Q25: One reason that governments may intervene in
Q43: Which of the following is a measure
Q44: <img src="https://d2lvgg3v3hfg70.cloudfront.net/TB1748/.jpg" alt=" -Consider a market
Q54: If the tax rate increases with an
Q84: In the following figure, the first panel