Multiple Choice
In the following figure, the first panel shows a market situation prior to regulation and the second panel shows the effects of regulation. Figure 12.2 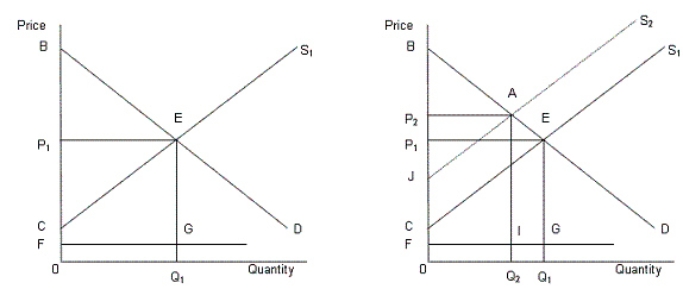 In the figure,
D: Demand curve for automobiles
S1: Supply curve of automobiles prior to regulation
S2: Supply curve of automobiles after regulation
FG: Clean up cost per unit
What is the total societal surplus prior to regulation described in Figure 12.2?
A) Area 0FGQ1.
B) Area BEP1.
C) Area CEP1.
D) Area FGEP1.
E) Area BEC.
Correct Answer:

Verified
Correct Answer:
Verified
Q1: Why do the regulated companies oppose deregulation?<br>A)They
Q13: If social regulation increases a firm's fixed
Q14: The figure below shows revenue and cost
Q24: In the following figure, the first panel
Q25: One reason that governments may intervene in
Q36: <img src="https://d2lvgg3v3hfg70.cloudfront.net/TB1748/.jpg" alt=" -Which of the
Q43: Which of the following is a measure
Q44: <img src="https://d2lvgg3v3hfg70.cloudfront.net/TB1748/.jpg" alt=" -Consider a market
Q54: If the tax rate increases with an
Q84: In the following figure, the first panel