Multiple Choice
In the following figure, the first panel shows a market situation prior to regulation and the second panel shows the effects of regulation. Figure 12.2 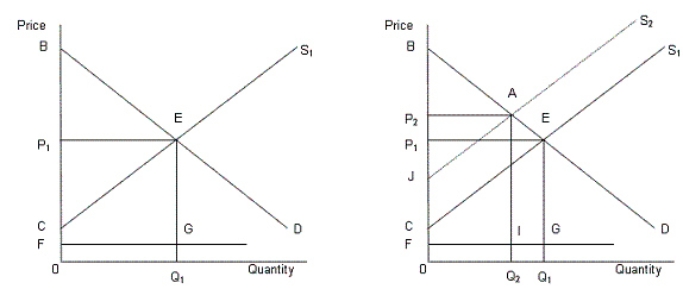 In the figure,
D: Demand curve for automobiles
S1: Supply curve of automobiles prior to regulation
S2: Supply curve of automobiles after regulation
FG: Clean up cost per unit
Refer to Figure 12.2.The regulation will benefit the society if:
A) area BAJ > area 0FIQ2.
B) area AECJ > area IGQ1Q2.
C) area IGQ1Q2 > area AECJ.
D) area BAJ > BAC.
E) area 0FIQ2 > area BAJ.
Correct Answer:

Verified
Correct Answer:
Verified
Q10: The figure below shows revenue and cost
Q13: If social regulation increases a firm's fixed
Q24: In the following figure, the first panel
Q34: In the following figure, the first panel
Q36: <img src="https://d2lvgg3v3hfg70.cloudfront.net/TB1748/.jpg" alt=" -Which of the
Q44: <img src="https://d2lvgg3v3hfg70.cloudfront.net/TB1748/.jpg" alt=" -Consider a market
Q56: <img src="https://d2lvgg3v3hfg70.cloudfront.net/TB1748/.jpg" alt=" -A monopolistic industry
Q83: In the following figure, the first panel
Q86: In the following figure, the first panel
Q86: The argument made in favor of privatization