menu-iconExamlexExamLexServices

Discover

Ask a Question
  1. All Topics
  2. Topic
    Business
  3. Study Set
    Economics Study Set 7
  4. Exam
    Exam 13: Aggregate Expenditures
  5. Question
    The Figure Given Below Represents the Consumption Function of a Country
Solved

The Figure Given Below Represents the Consumption Function of a Country

Question 55

Question 55

Multiple Choice

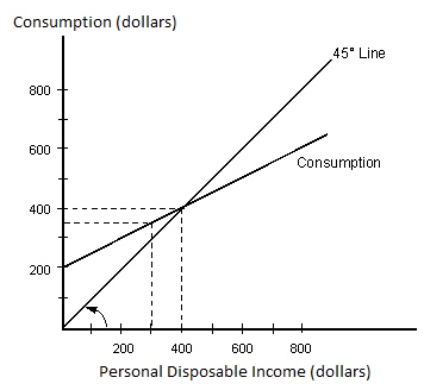
The figure given below represents the consumption function of a country. Figure 9.3 The figure given below represents the consumption function of a country. Figure 9.3   Refer to Figure 9.3.When disposable income is $800, consumption spending must equal: A) $200. B) $700. C) $600. D) $800. E) $400. Refer to Figure 9.3.When disposable income is $800, consumption spending must equal:

A) $200.
B) $700.
C) $600.
D) $800.
E) $400.

Correct Answer:

verifed

Verified

Unlock this answer now
Get Access to more Verified Answers free of charge

Related Questions

Q50: An MPI of 0.4 indicates that for

Q51: When capacity utilization rate is high:<br>A)the price

Q52: As disposable income increases, consumption spending will

Q53: Saving remaining constant, the average propensity to

Q54: The figure given below represents the consumption

Q56: The aggregate expenditures function:<br>A)has the same slope

Q57: Autonomous consumption is defined as:<br>A)the domestic consumption

Q58: As a function of real GDP (real

Q59: When we assume that investment is autonomous

Q60: The consumption function illustrates that:<br>A)saving increases as

Examlex

ExamLex

About UsContact UsPerks CenterHomeschoolingTest Prep

Work With Us

Campus RepresentativeInfluencers

Links

FaqPricingChrome Extension

Download The App

Get App StoreGet Google Play

Policies

Privacy PolicyTerms of ServiceHonor CodeCommunity Guidelines

Scan To Download

qr-code

Copyright © (2025) ExamLex LLC.

Privacy PolicyTerms Of ServiceHonor CodeCommunity Guidelines