Multiple Choice
The figure given below represents the consumption function of a country. Figure 9.3 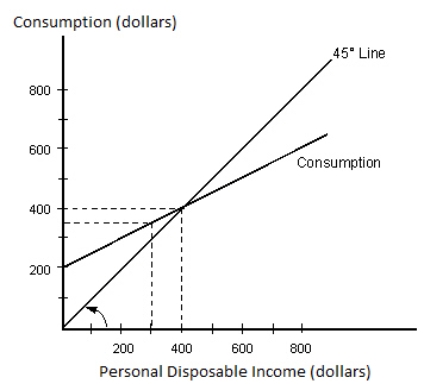 Refer to Figure 9.3.The savings function of the country will have a positive intercept at all income levels of _____.
A) less than $200
B) greater than $200
C) less than $600
D) greater than $400
E) less than $800
Correct Answer:

Verified
Correct Answer:
Verified
Q49: An increase in the marginal propensity to
Q50: An MPI of 0.4 indicates that for
Q51: When capacity utilization rate is high:<br>A)the price
Q52: As disposable income increases, consumption spending will
Q53: Saving remaining constant, the average propensity to
Q55: The figure given below represents the consumption
Q56: The aggregate expenditures function:<br>A)has the same slope
Q57: Autonomous consumption is defined as:<br>A)the domestic consumption
Q58: As a function of real GDP (real
Q59: When we assume that investment is autonomous