Multiple Choice
The figure given below shows the consumption functions of an economy. Figure 9.4 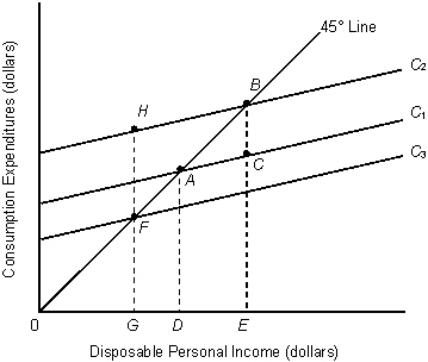 Refer to Figure 9.4.Which of the following could explain a downward shift of the consumption function from C1 to C3?
A) An increase in household wealth
B) A decrease in the proportion of young people in the population
C) An increase in the size of the population
D) A decrease in consumer confidence
E) An autonomous decrease in saving
Correct Answer:

Verified
Correct Answer:
Verified
Q1: The table given below reports the consumption
Q2: Dissaving occurs when the consumption function lies
Q3: The average propensity to save (APS)is the
Q5: Which of the following will cause the
Q6: As disposable income rises:<br>A)consumption falls as a
Q7: Suppose that the consumption function crosses the
Q8: In the table given below Y represent
Q9: The figure given below represents the saving
Q10: MPI refers to the percentage of additional
Q11: Which of the following is least likely