Multiple Choice
The figure given below represents the saving function of an economy. Figure 9.1 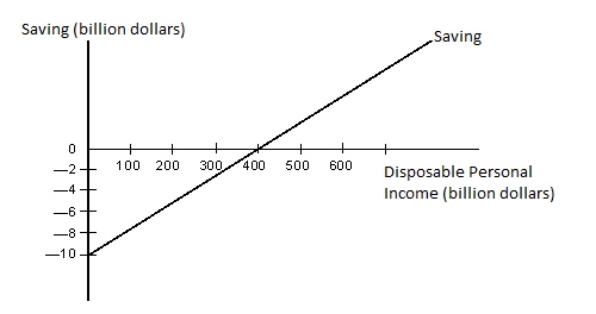 Refer to Figure 9.1.An increase in autonomous consumption would be illustrated by:
A) an upward shift of the saving function.
B) a downward shift of the saving function.
C) a downward shift of the corresponding consumption function.
D) a movement to the right along the saving function.
E) a movement to the left along the saving function.
Correct Answer:

Verified
Correct Answer:
Verified
Q4: The figure given below shows the consumption
Q5: Which of the following will cause the
Q6: As disposable income rises:<br>A)consumption falls as a
Q7: Suppose that the consumption function crosses the
Q8: In the table given below Y represent
Q10: MPI refers to the percentage of additional
Q11: Which of the following is least likely
Q12: The table given below reports the consumption
Q13: If it is assumed that there are
Q14: The figure given below shows the aggregate