Multiple Choice
The figure given below shows the aggregate expenditures function of an economy. Figure 9.5 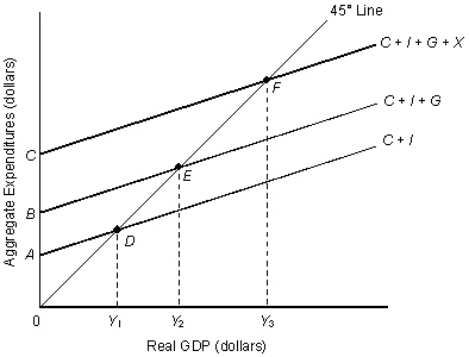 Refer to Figure 9.5.The amount of government spending is indicated by the distance _____.
A) Y1Y2
B) DE
C) Y2Y3
D) BC
E) AB
Correct Answer:

Verified
Correct Answer:
Verified
Related Questions
Q9: The figure given below represents the saving
Q10: MPI refers to the percentage of additional
Q11: Which of the following is least likely
Q12: The table given below reports the consumption
Q13: If it is assumed that there are
Q15: What would be the impact of an
Q16: As household wealth increases, it will experience
Q17: Which of the following would cause a
Q18: Other things equal, a marginal propensity to
Q19: The income net of taxes is called