Multiple Choice
The figure given below represents the long-run equilibrium in the aggregate demand and aggregate supply model. Figure 8.2 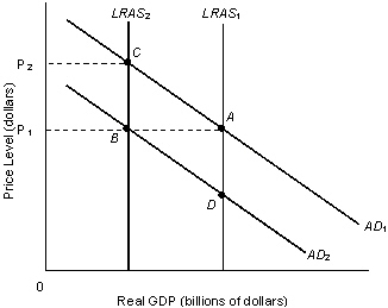 Refer to Figure 8.2.The combination of rising prices and falling output is known as stagflation.This phenomenon is represented by which of the following shifts?
A)  to
to
B)  to
to
C)  to
to
D)  to
to
E) The combination of  to
to and
and to
to
Correct Answer:

Verified
Correct Answer:
Verified
Q3: In the long run, increased consumption spending
Q4: Which of the following would result in
Q5: Suppose the long-run aggregate supply curve shifts
Q6: Other things equal, an increase in aggregate
Q7: Assuming a fixed exchange rate, a decrease
Q9: The figure given below represents the long-run
Q10: If a large number of laborers shift
Q11: Assume that the AD curve is held
Q12: Which of the following will cause net
Q13: When the foreign price level falls, domestic