Multiple Choice
The figure given below represents the long-run equilibrium in the aggregate demand and aggregate supply model. Figure 8.2 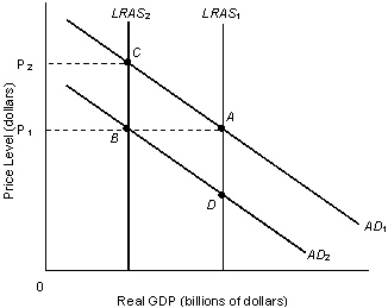 Refer to Figure 8.2.A movement from equilibrium point A to equilibrium point B would be the result of a(n) :
A) increase in consumer confidence and a decrease in productivity.
B) technological advances and domestic price decreases.
C) decrease in productivity and a decrease in government spending.
D) increase in production costs and greater consumer confidence.
E) decrease in domestic prices and decrease in direct taxes.
Correct Answer:

Verified
Correct Answer:
Verified
Q4: Which of the following would result in
Q5: Suppose the long-run aggregate supply curve shifts
Q6: Other things equal, an increase in aggregate
Q7: Assuming a fixed exchange rate, a decrease
Q8: The figure given below represents the long-run
Q10: If a large number of laborers shift
Q11: Assume that the AD curve is held
Q12: Which of the following will cause net
Q13: When the foreign price level falls, domestic
Q14: Identify the correct statement.<br>A)As domestic income rises,